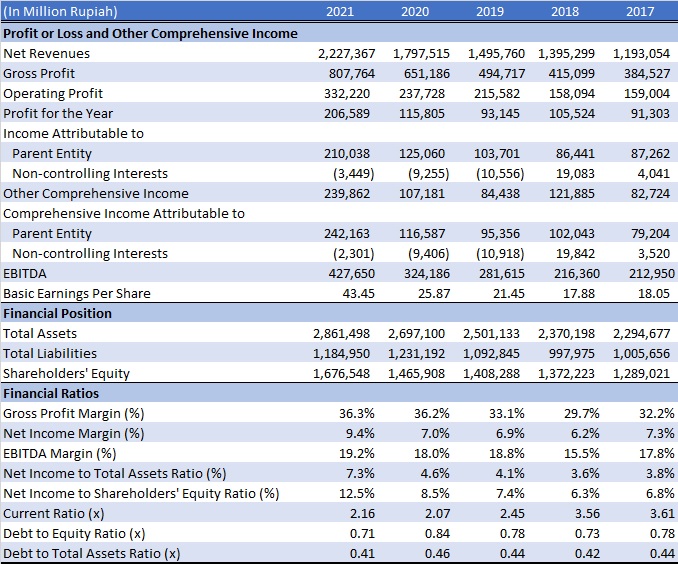
FINANCIAL HIGHLIGHTS
| (In Million Rupiah) | 2023 | 2022 | 2021* | 2020* | 2019 |
|---|---|---|---|---|---|
| Profit or Loss and Other Comprehensive Income | |||||
| Net Revenues | 2,860,388 | 2,808,699 | 2,227,367 | 1,797,515 | 1,495,760 |
| Gross Profit | 1,176,111 | 978,765 | 799,815 | 651,186 | 494,717 |
| Operating Profit | 606,474 | 447,461 | 311,098 | 237,728 | 215,582 |
| Profit for the Year | 440,543 | 312,502 | 188,612 | 115,805 | 93,145 |
| Income Attributable to | |||||
| Parent Entity | 430,521 | 307,415 | 192,070 | 125,061 | 103,701 |
| Non-controlling Interests | 10,022 | 5,087 | (3,458) | (9,255) | (10,556) |
| Other Comprehensive Income | 438,042 | 318,061 | 211,362 | 107,181 | 84,438 |
| Comprehensive Income Attributable to | |||||
| Parent Entity | 428,066 | 312,899 | 213,679 | 116,587 | 95,356 |
| Non-controlling Interests | 9,976 | 5,162 | (2,318) | (9,406) | (10,918) |
| EBITDA** | 719,042 | 555,655 | 406,529 | 324,186 | 281,615 |
| Basic Earnings Per Share | 14,85 | 63,43 | 39,74 | 25,87 | 21,45 |
| Financial Position | |||||
| Total Assets | 3,597,041 | 3,435,476 | 2,858,166 | 2,687,655 | 2,501,133 |
| Total Liabilities | 1,109,392 | 1,210,746 | 1,169,804 | 1,181,432 | 1,092,845 |
| Shareholders’ Equity | 2,487,650 | 2,224,730 | 1,688,362 | 1,506,223 | 1,408,288 |
| Financial Ratios | |||||
| Gross Profit Margin (%) | 41,12% | 34,85% | 35,91% | 36,23% | 33,07% |
| Net Income Margin (%) | 15,05% | 10,95% | 8,62% | 6,96% | 6,93% |
| EBITDA Margin (%) | 25,14% | 19,78% | 18,25% | 18,04% | 18,83% |
| Net Income to Total Assets Ratio (%) | 11,97% | 8,95% | 6,72% | 4,65% | 4,15% |
| Net Income to Shareholders’ Equity Ratio (%) | 17,31% | 13,82% | 11,38% | 8,3% | 7,36% |
| Current Ratio (x) | 2,38 | 2,45 | 2,16 | 2,07 | 2,45 |
| Debt to Equity Ratio (x) | 0,45 | 0,54 | 0,69 | 0,78 | 0,78 |
| Debt to Total Assets Ratio (x) | 0,31 | 0,35 | 0,41 | 0,44 | 0,44 |
*) Restated **) EBITDA formula: Operating Profit + Depreciation + Amortization
Slide table to view detail
FINANCIAL REPORT
| 2023 | Financial Report |
|---|---|
| FY 2023 | Download Financial Report FY 2023 |
| Q3 | Download Financial Report Q3 2023 |
| Q2 | Download Financial Report Q2 2023 |
| Q1 | Download Financial Report Q1 2023 |
| 2022 | Financial Report |
|---|---|
| FY 2022 | Download Financial Report Q4 2022 |
| Q3 | Download Financial Report Q3 2022 |
| Q2 | Download Financial Report Q2 2022 |
| Q1 | Download Financial Report Q1 2022 |
| 2021 | Financial Report |
|---|---|
| FY 2021 | Download Financial Report FY 2021 |
| Q3 | Download Financial Report Q3 2021 |
| Q2 | Download Financial Report Q2 2021 |
| Q1 | Download Financial Report Q1 2021 |
| 2020 | Financial Report |
|---|---|
| FY 2020 | Download Financial Report FY 2020 |
| Q3 | Download Financial Report Q3 2020 |
| Q2 | Download Financial Report Q2 2020 |
| Q1 | Download Financial Report Q1 2020 |
| 2019 | Financial Report |
|---|---|
| FY 2019 | Download Financial Report FY 2019 |
| Q3 | Download Financial Report Q3 2019 |
| Q2 | Download Financial Report Q2 2019 |
| Q1 | Download Financial Report Q1 2019 |
| 2018 | Financial Report |
|---|---|
| FY 2018 | Download Financial Report FY 2018 |
| Q3 | Download Financial Report Q3 2018 |
| Q2 | Download Financial Report Q2 2018 |
| Q1 | Download Financial Report Q1 2018 |
| Year | Quartal | Financial Report |
|---|---|---|
| 2017 | FY 2017 | Download Report |
| 2017 | Q3 | Download Report |
| 2017 | Q2 | Download Report |
| 2017 | Q1 | Download Report |
| 2016 | FY 2016 | Download Report |
| 2016 | Q3 | Download Report |
| 2016 | Q2 | Download Report |
| 2016 | Q1 | Download Report |
| 2015 | FY 2015 | Download Report |
| 2015 | Q3 | Download Report |
| 2015 | Q2 | Download Report |
| 2015 | Q1 | Download Report |